Analytics metrics & API access


More visibility into listening hours, improved charts and direct API access.
Better audience data helps publishers make stronger programming decisions and demonstrate the value of their digital listenership to advertisers. The latest feature update to our best-in-class analytics dashboard delivers more ways to gain audience insights.
Key metrics
All charts in our dashboard were originally implemented to report on Unique Users. This is certainly the most valuable metric for most publishers, but in many scenarios it is desirable to focus on Active Sessions (AS) or Total Listen Hours (TLH). Our dashboard now allows selecting which key metric to display:
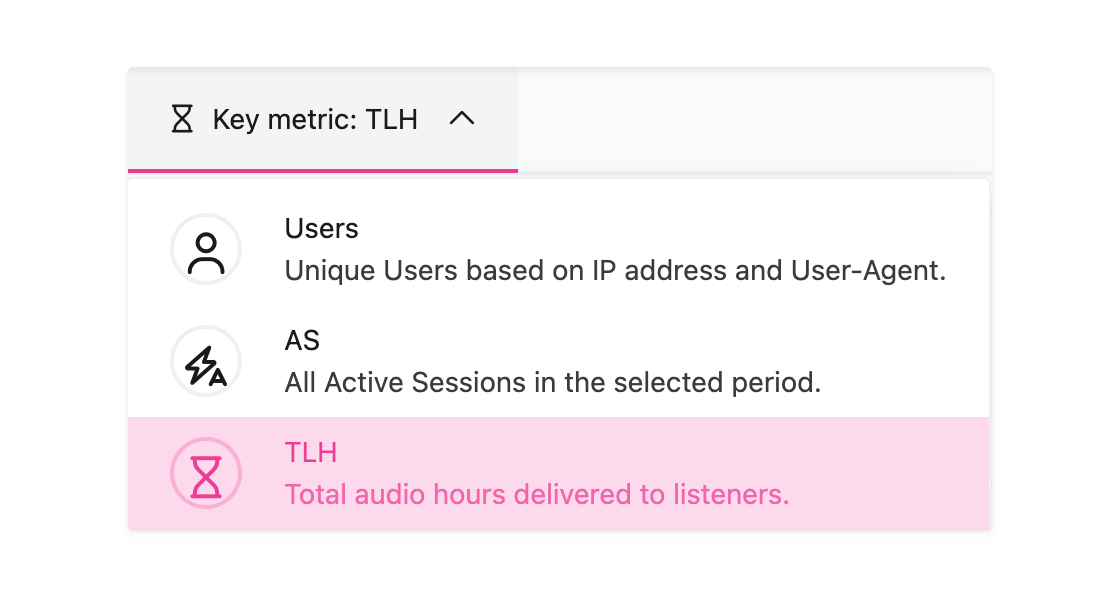
This powerful approach allows every chart and table in the dashboard to switch between metrics, unlocking a whole new way to understand listenership.
TLH is especially valuable for identifying which content drives the longest audience engagement - as opposed to the most.
Improved charts
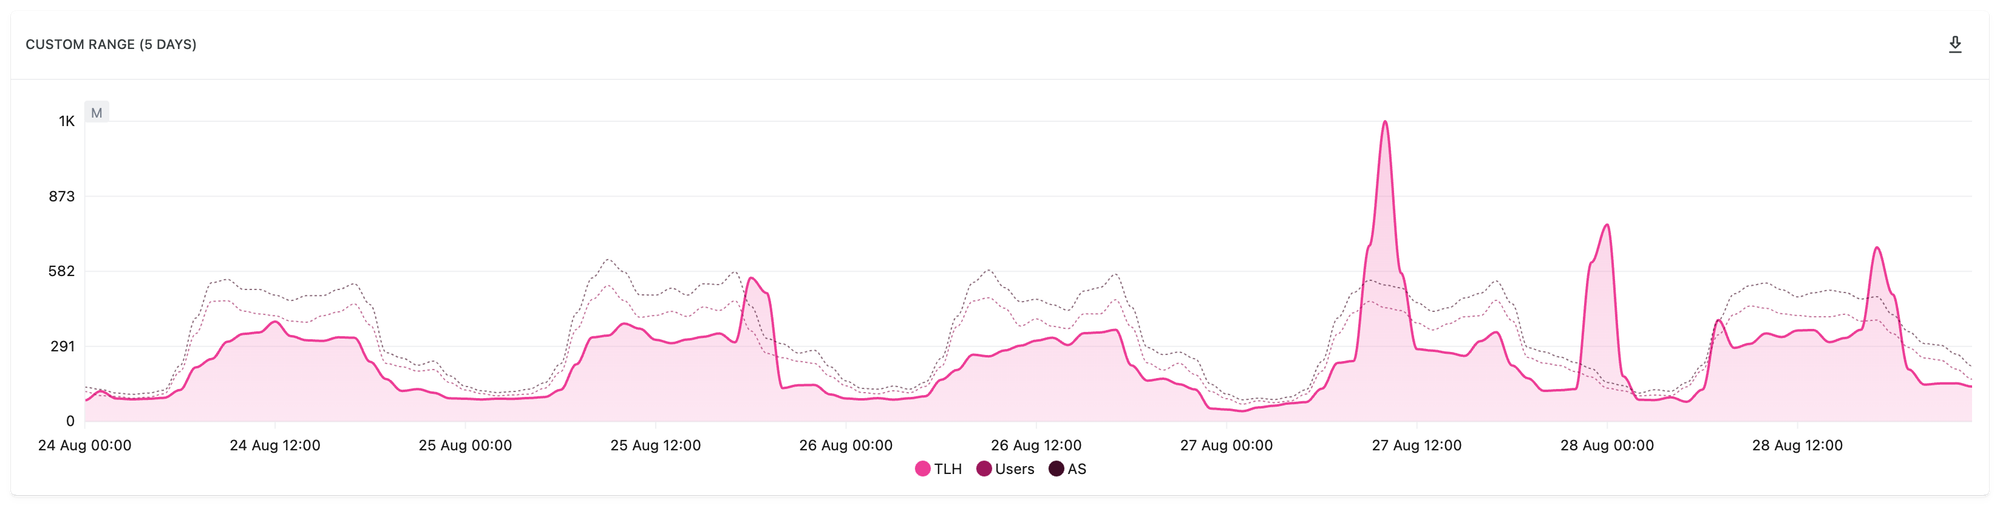
Most of our charts received a visual update, for example our "Overview" time series chart now displays all three metrics simultaneously and adapts to focus the selected key metric, with others provided as secondary indicators.
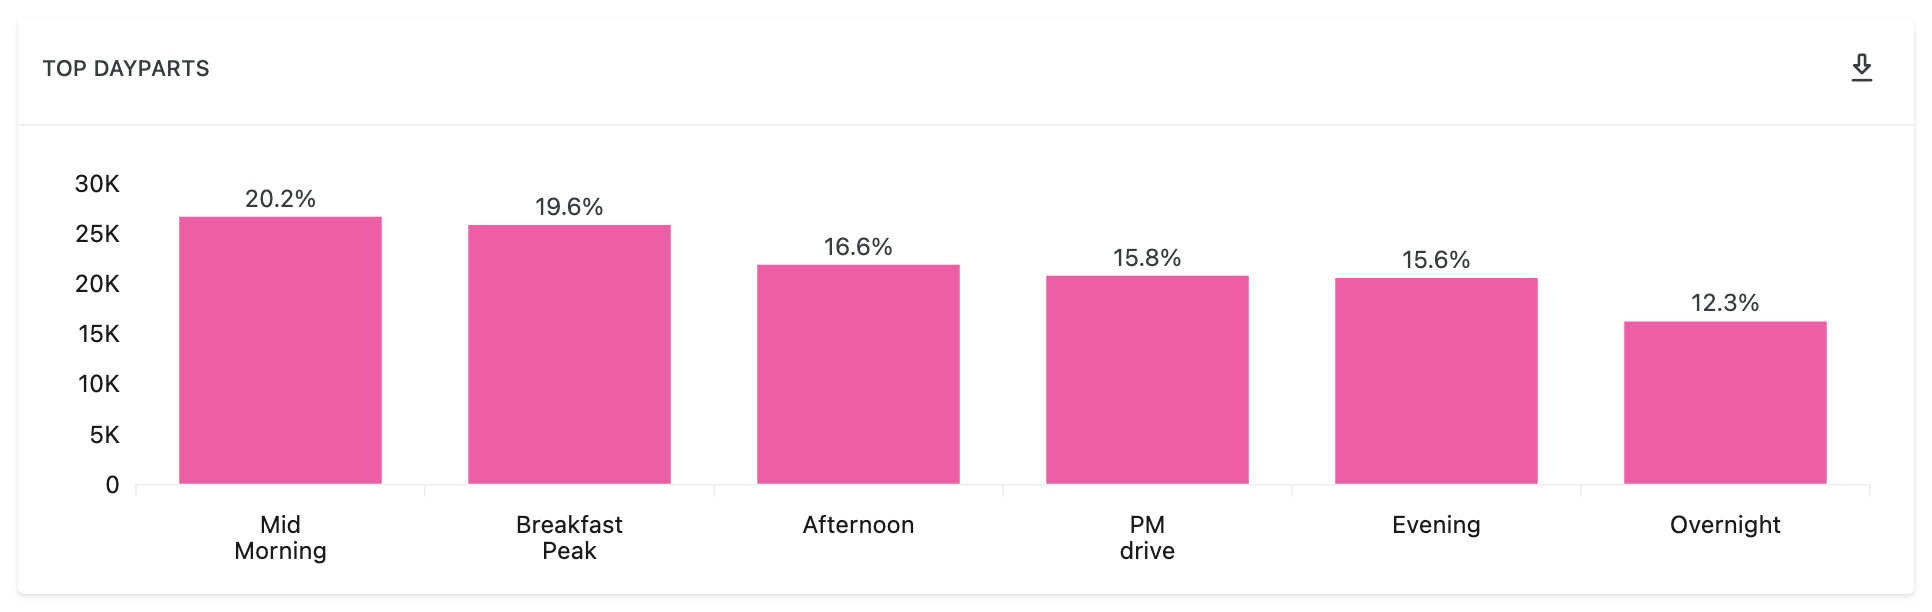
All bar charts now display their percentage values alongside the raw values, one of our most often requested features!
API access
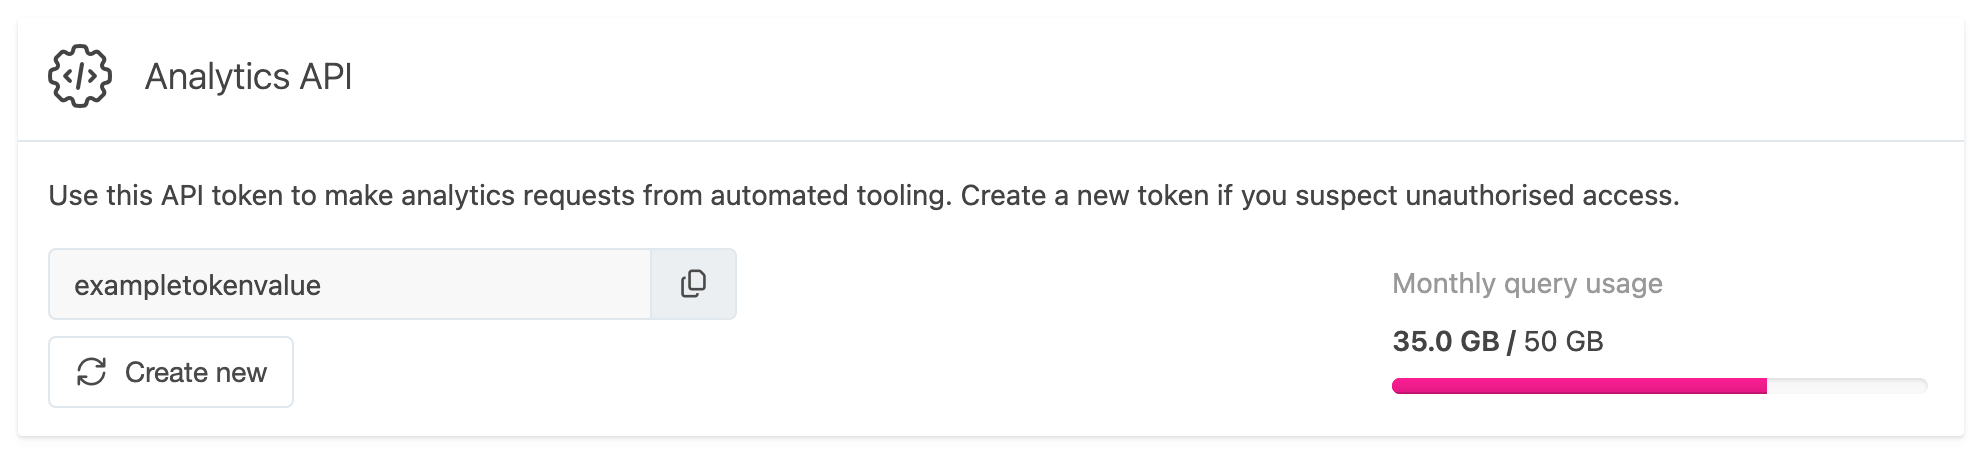
Last but certainly not least, publishers can now access their analytics data programmatically via our API. This allows for easy automation of internal workflows and analytics displays. See our FAQ article for more details.
This update applies to our stream, podcast and advertising analytics. Some features are limited to specific hosting packages.
Related content
- The Analytics overview on our FAQ contains detailed information on how our analytics product works.