
Analytics 2024
The best-in-class audio analytics, now even better.


The best-in-class audio analytics, now even better.
Our podcast and stream analytics was already widely regarded as one of the best in the market for radio stations and podcasters to understand their audiences. But we still wanted to deliver "more" to our customers. More features, more insights.
After a heroic effort from our team, we are now ready to deliver.
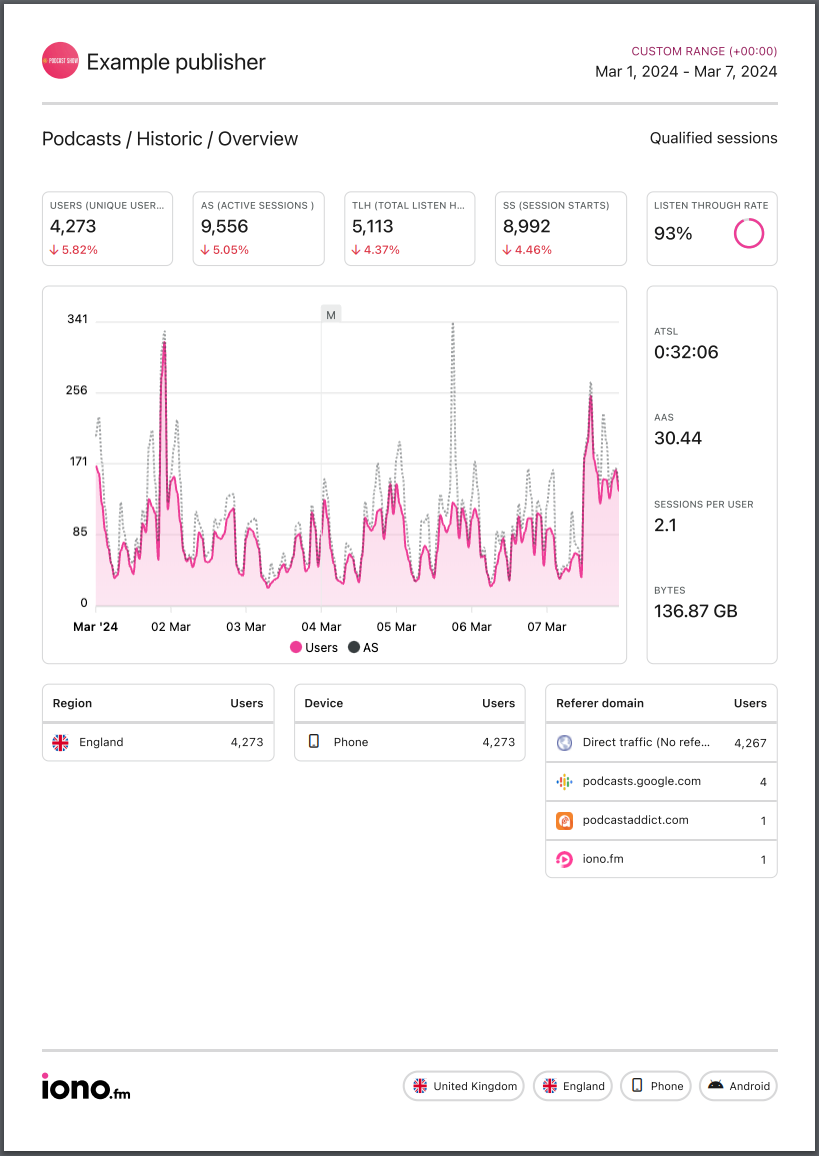
Completely reworked user interface
From large updates like new chart types and page layout to small user experience delights, no part of our interface was left untouched.
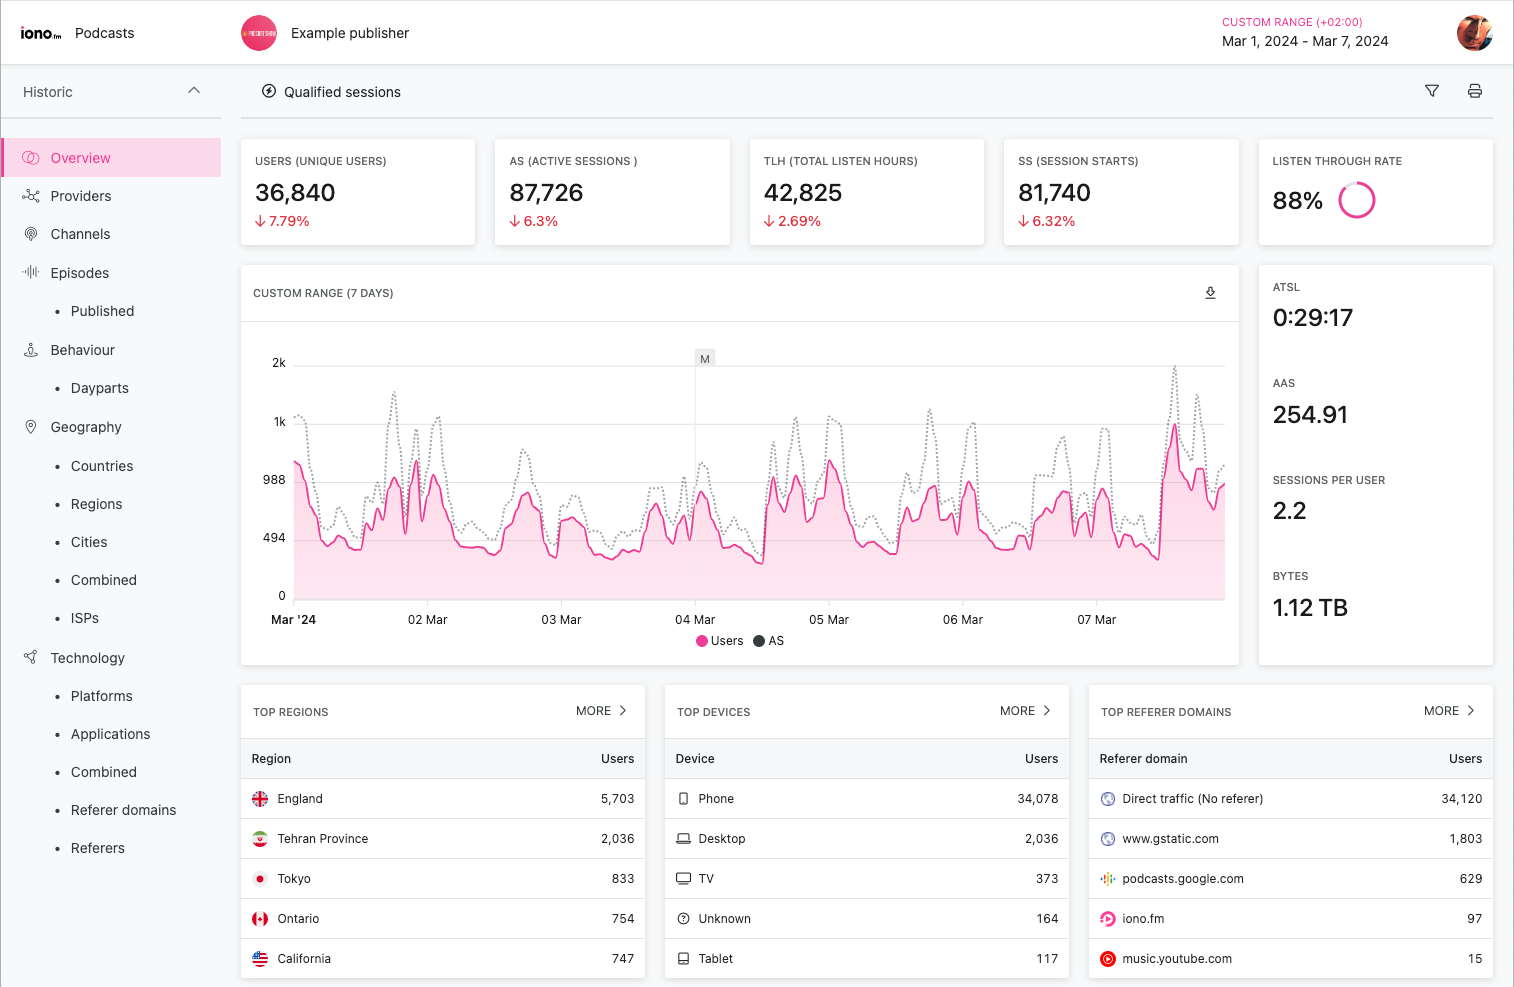
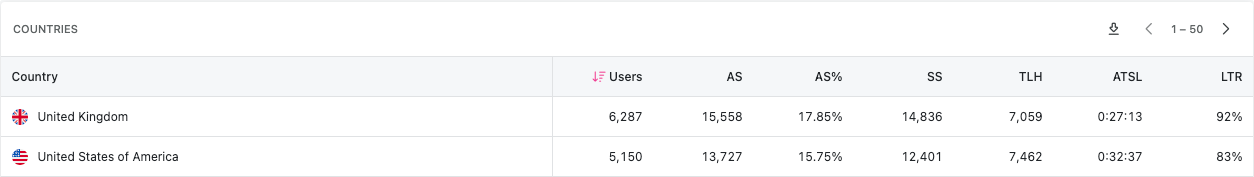
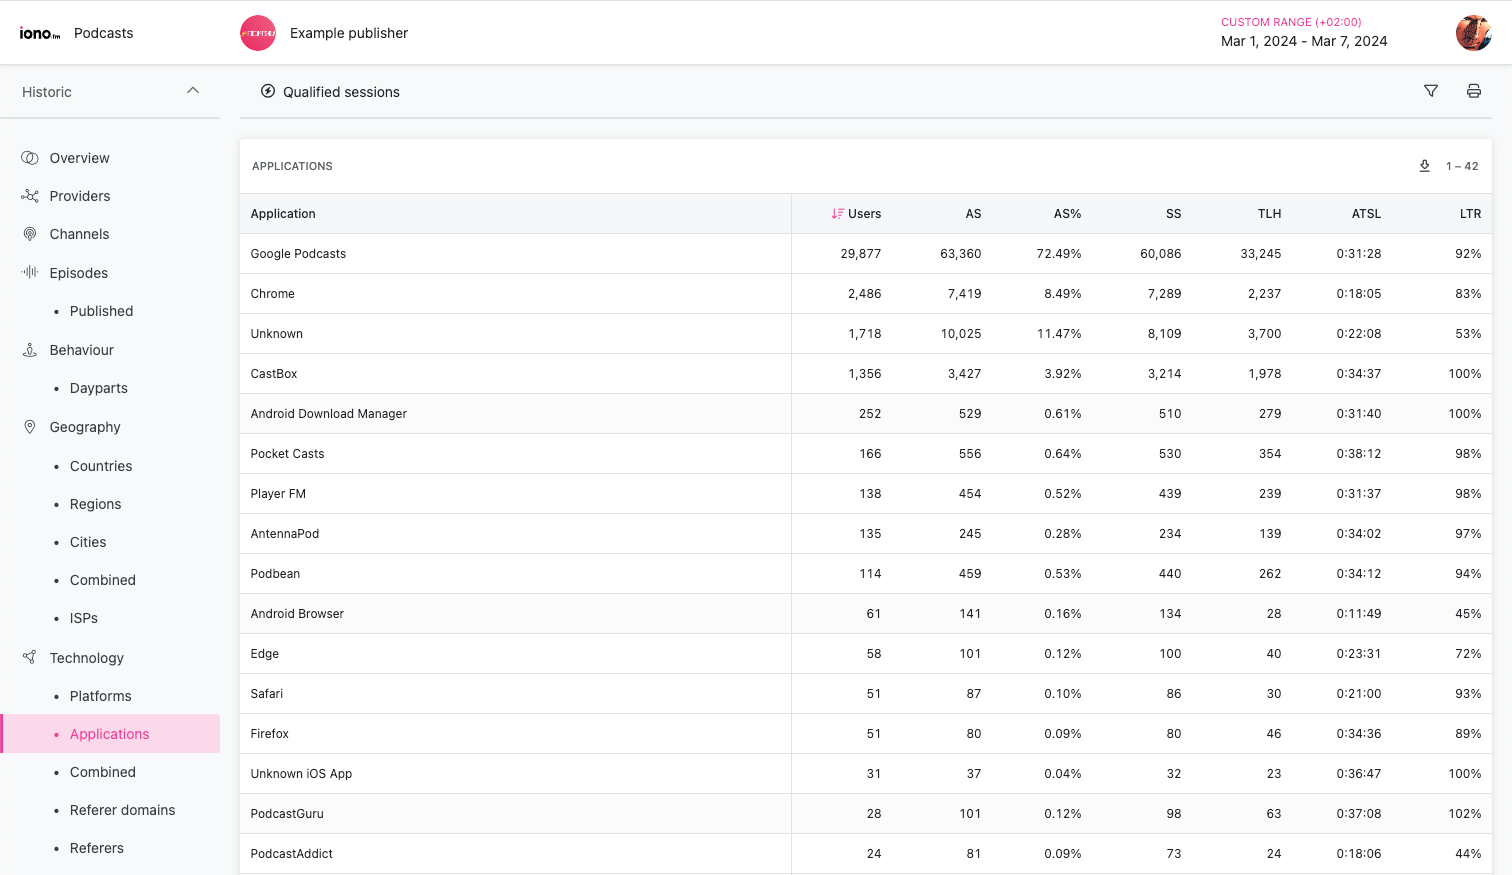
Six different metrics
All breakdown tables now track up to six different metrics: unique users, active sessions, session starts, total listen hours, average time spent listening (stream) and listen-through-rate (podcast).
More than 15 dimensions
Choose from a wide range of dimensions to browse by: stream, podcast show, podcast episode, user behaviour, daypart, geography, country, region, city, ISP, device, platform, application, referer and more.
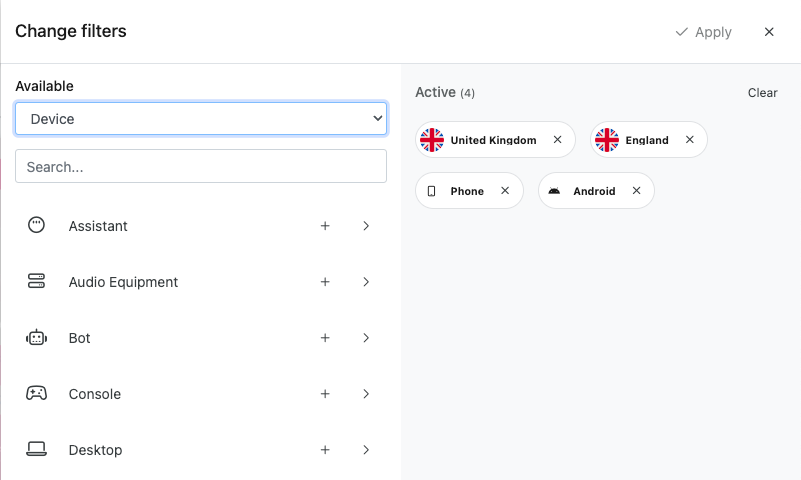
Ad-hoc filters
Apply one or even multiple filters on data to show usage only from specific countries, regions, devices or platforms.
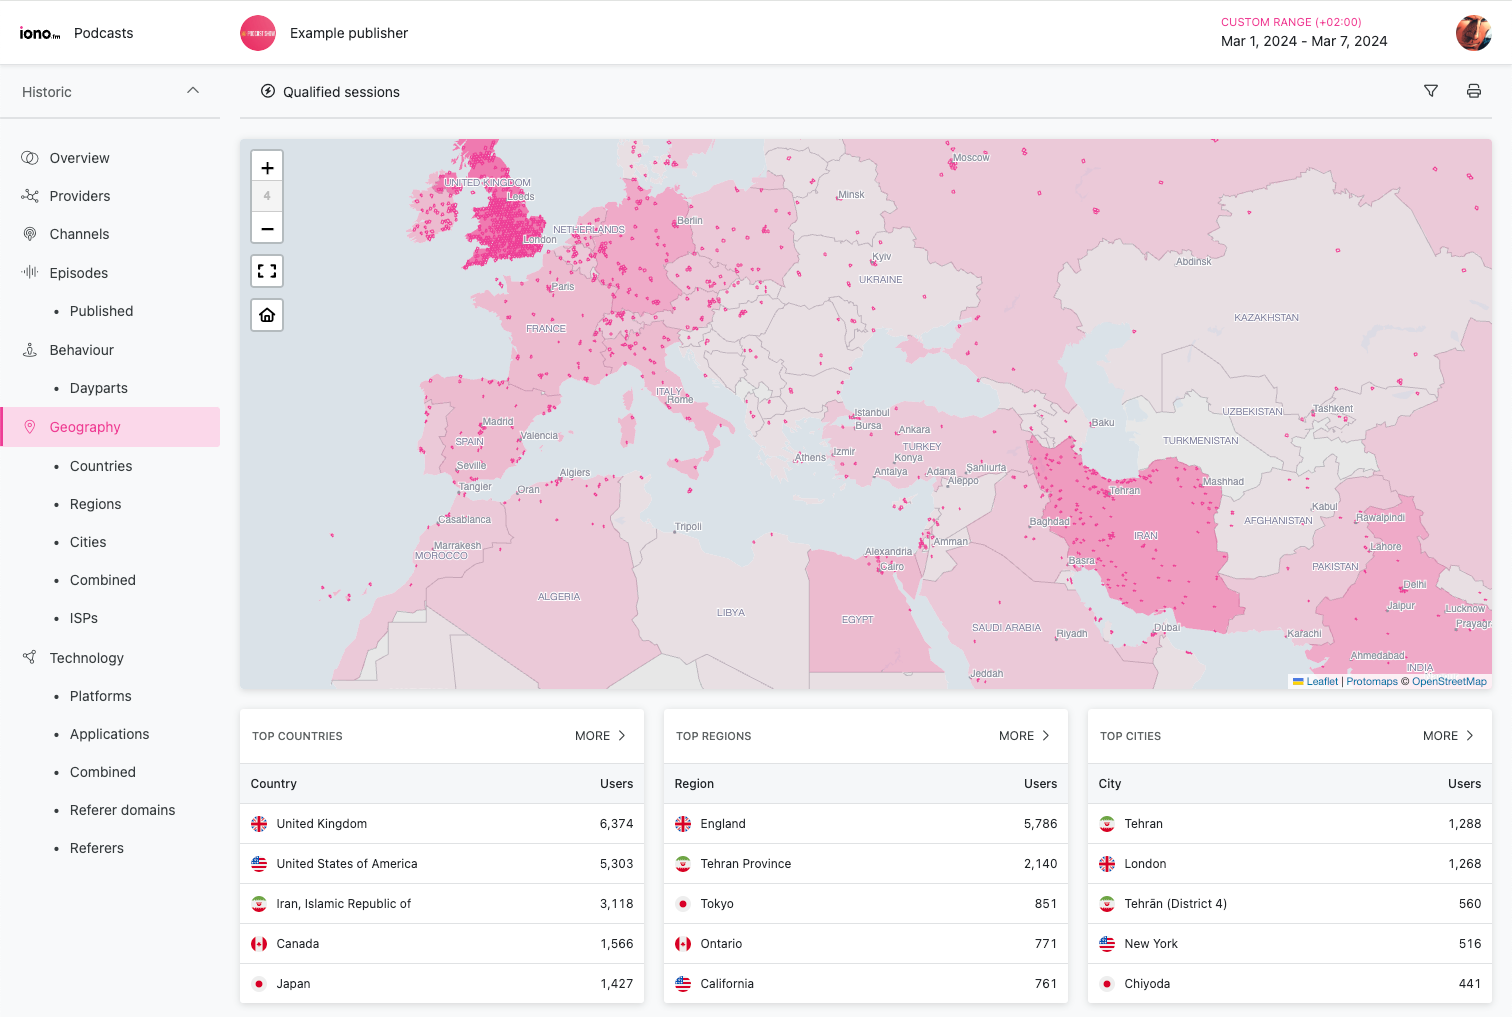
Brand new geospatial mapping
Mapping now provides both country and region choropleth displays, in additional to location cells. This provides a much richer view of user distribution than before.
Hundreds of new applications recognised
We've added hundreds of new user-agent entries to recognize a much wider range of audio specific application and devices.
Print stunning PDF
A beautiful "Print" layout ensures great looking PDFs out of the box.
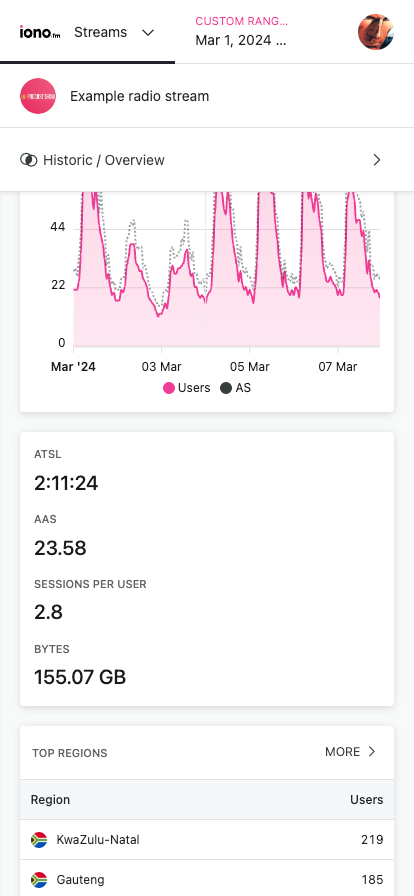
Mobile friendly
Last but not least, analytics on the go! A mobile friendly layout provides access to analytics on any modern handset.
Find more details about our analytics at:
- FAQ articles: Metrics & Measurement, User Interface.
- Website product page.
Cover photo by Shaun Darwood / Unsplash