
New Analytics dashboard
We are excited to announce our new analytics dashboard! We now provide deeper insights into a publisher's audience, while adopting industry standard metrics.


We are excited to announce our new analytics dashboard. For more than 5 years our usage reports has been serving customers well enough, but the industry has moved on, and it was time for us to deliver a completely new take on analytics.
We knew we wanted to update our customer's analytics experience to provide deeper insights into their audience, while at the same adopting metrics that are standards in the industry - enabling universally recognised data for all stakeholders.
Our completely reworked analytics dashboard offers all of this and more.
Standards
When we originally implemented our usage reports, there were no standards available around measuring podcast audio consumption, and even live-stream usage measurements were often drastically different between providers.
In 2021, times have changed for the best, and our analytics processing pipeline has been completely rebuilt to be compliant with the Interactive Advertising Bureau (IAB) standards for audio measurement.
Note: The IAB Tech Lab offers an official compliancy testing program for analytics implementations. Our implementation is fully compliant in that it follows all IAB measurement standards, but is not officially certified. We hope to complete the official compliancy certification in the future, but did not want to delay this release to our customers.
Our analytics implements the Podcast Measurement Technical Guidelines specification, but also general IAB rules around stream session expiry times, minimum listening durations and how audience measurements are derived.
New metrics
We now provide all the standarised metrics expected from audio analytics:
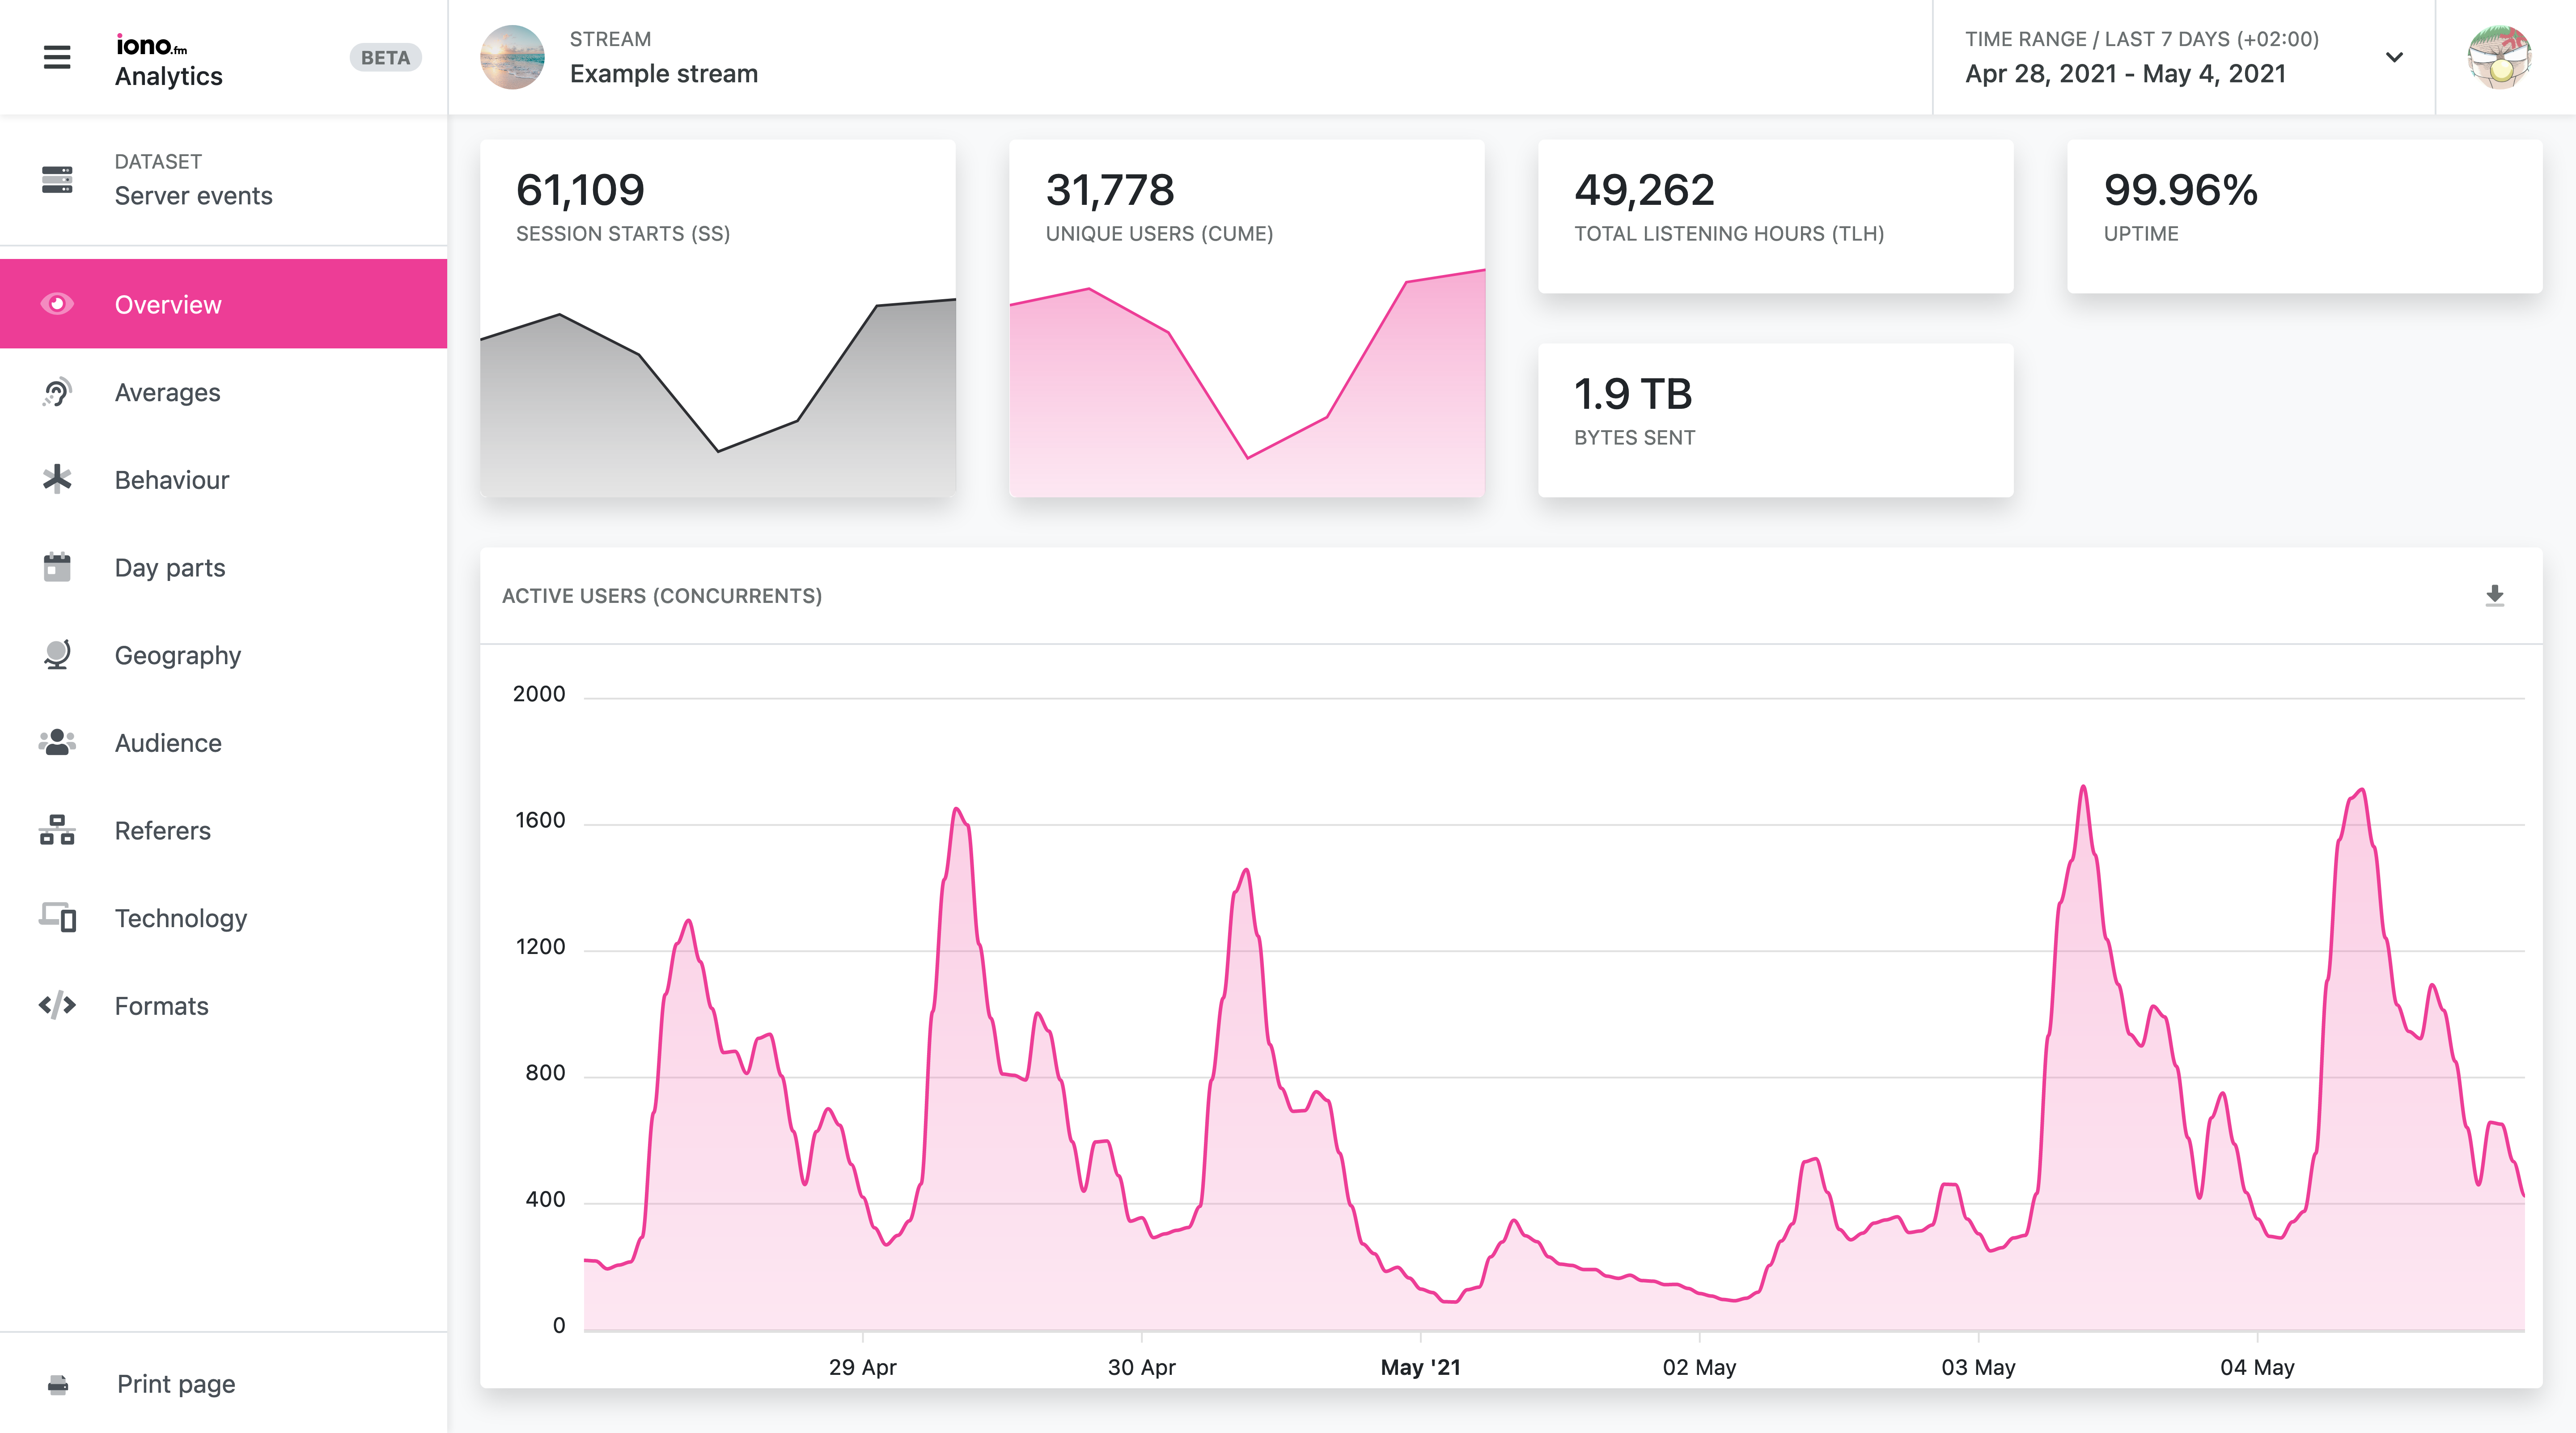
- Unique Users (CUME) and Total Listen Hours (TLH) are certainly the most requested metrics.
- Other new metrics: Sessions Starts (SS), Active Sessions (AS), Average Active Sessions (AAS), Average Time Spent Listening (ATSL), Total Bytes Sent, Average Minutes per User, Average Sessions per User, Sessions complete (podcast only), Sessions midway (podcast only).
And we provide this for all stream and podcast packages! Several additional views give further insight into when, where and how content is consumed:
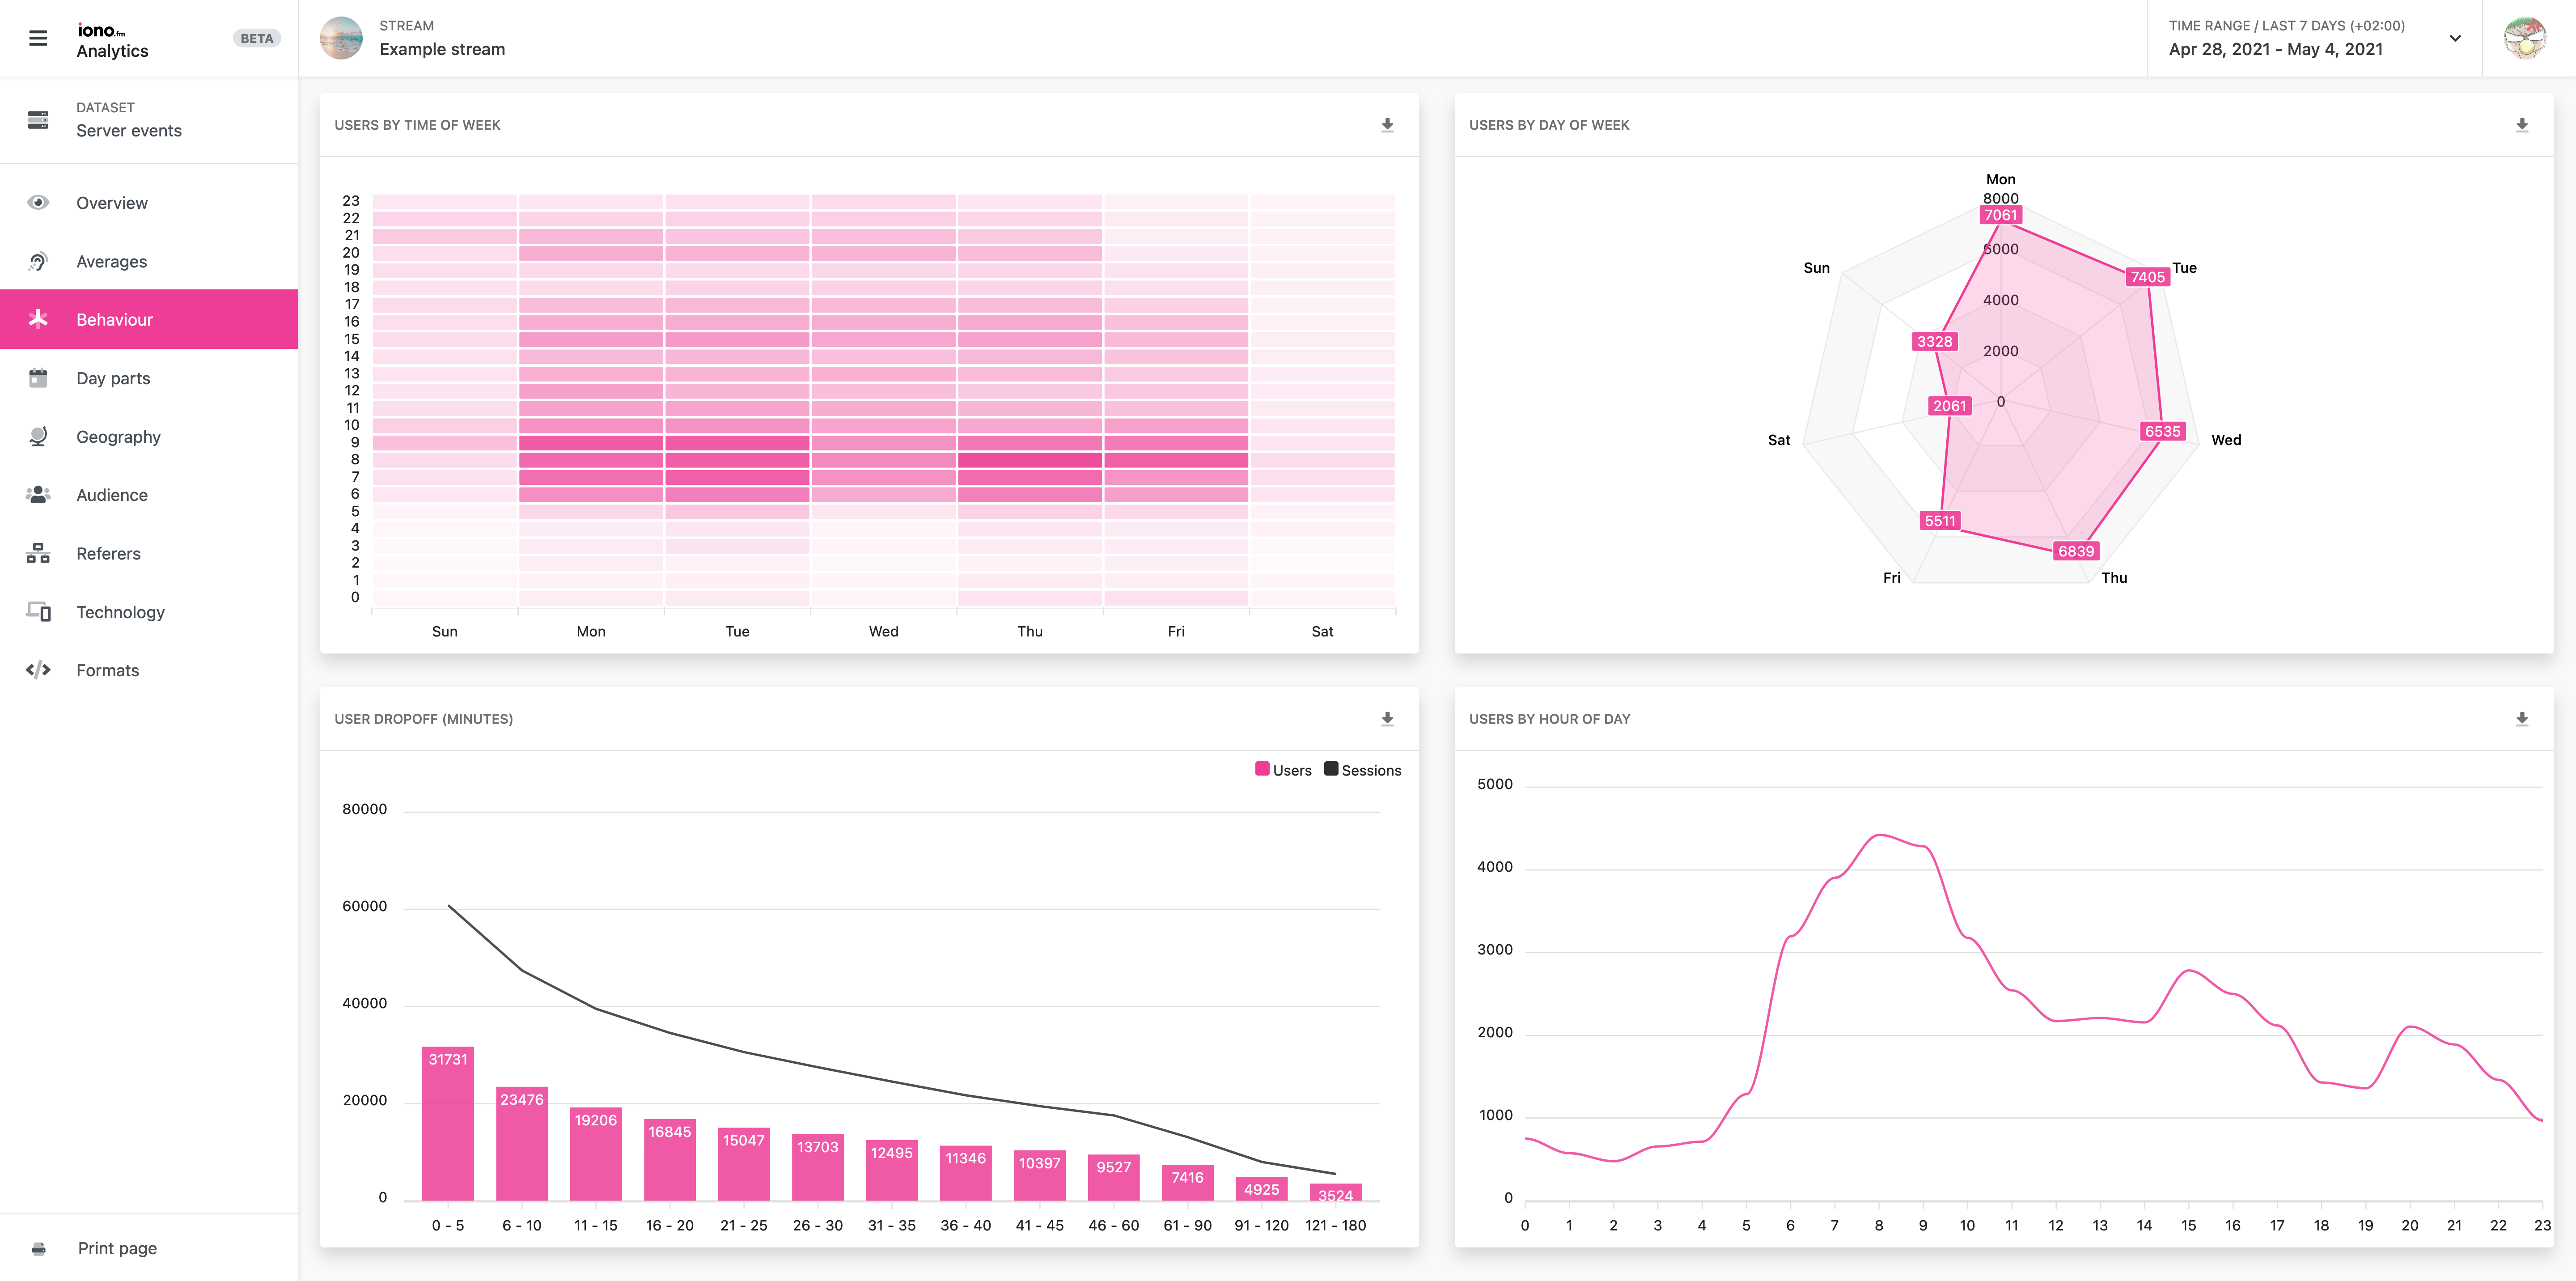
- Users by time of week, Users by day of week, Drop-off rate, Day parts, Referer information, Geo region and map and more.
New UI, same great features
Our analytics is now delivered inside a modern new dashboard, but retains core features of the previous reports:
- CSV downloads of all stats
- Displayed in the user's timezone
- Explore different time ranges
- Printable views
Availability
The new analytics dashboard is available immediately alongside our legacy usage reports, and all podcast and stream providers have access to them.
Available metrics are based on the publisher's package, see the stream package or podcast package breakdown of available fields.
All packages have access to at least the same information that was available on the legacy usage reports, while some new views are only available on higher packages.
Impact
When changing measurement standards completely, it is expected that there will be differences in the numbers that are reported to our customers.
Existing publishers can see this FAQ article for the full details on how this impacts them and how to access the dashboard.
See the Analytics FAQ page for full details on how our new analytics works and looks.